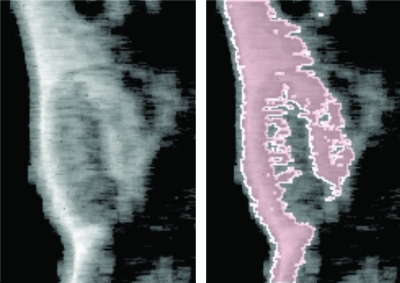
Figure 9.
Closeup of thresholded smoothing spline images. (Left) Image based on backscattered RF obtained from MDA435 tumor implanted mouse (same RF data used in Figs. 2345) immediately after injection of -targeted nanoparticles. (Right) Image based on backscattered RF obtained from the same region 60 min after injection, “colorized” so that all pixels in the bottom 44% of the histogram (constructed using the 0-60 min images obtained from this mouse) are red.

