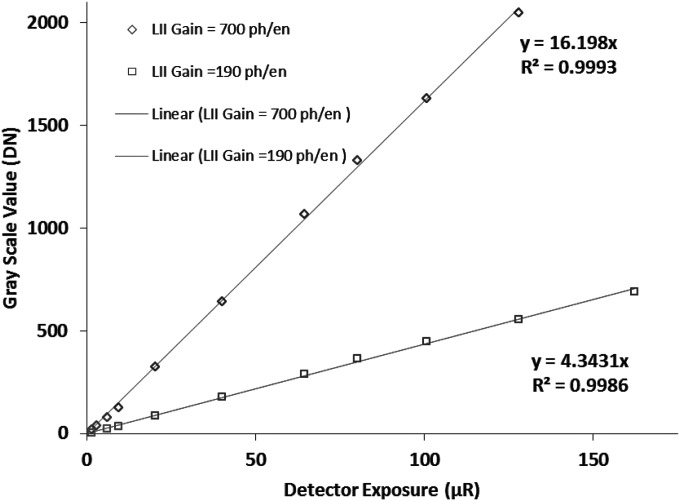
Figure 8.
Characteristic response curves for the MAF. The mean digital numbers of the flat-field images are plotted versus detector input exposure for two different LII nominal gains (700 photons∕electron and 190 photons∕electron). The graphs show the linear regression fits to the data and demonstrate the linearity of the MAF with exposure for different LII gains.

