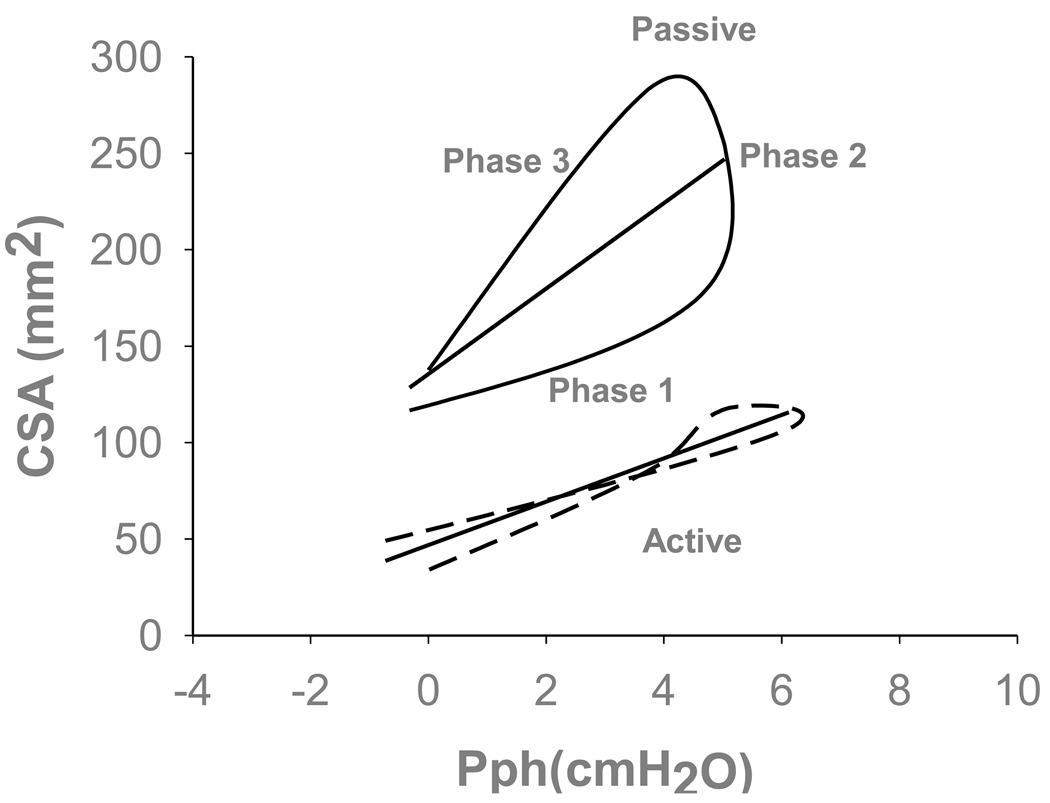
Figure 5.
Representative example of retro palatal cross sectional area (CSA) and pharyngeal pressure (Pph) relationships for active and passive breaths (dotted and solid lines, respectively). Note that the passive breath displayed hysteresis relative to the triggered active breath on the same positive pressure. The total slope of passive breath is significantly higher than active breath. Partitioned slope of the passive breath is higher during expiration relative to the active breath. Phase 1 (inspiratory) was defined as the slope of the regression line between the beginning of inspiration and peak inspiration. Phase 2 (post-inspiratory) was defined as the slope of the regression line between the peak inspiration and end inspiration. Phase 3 (expiratory) was defined as the slope of CSA vs. Pph between the beginning of expiration and end of expiration. The straight lines represent the total area-pressure relationship for each individual representative breaths defined as the slope of the regression line between the beginning of inspiration and end expiration.

