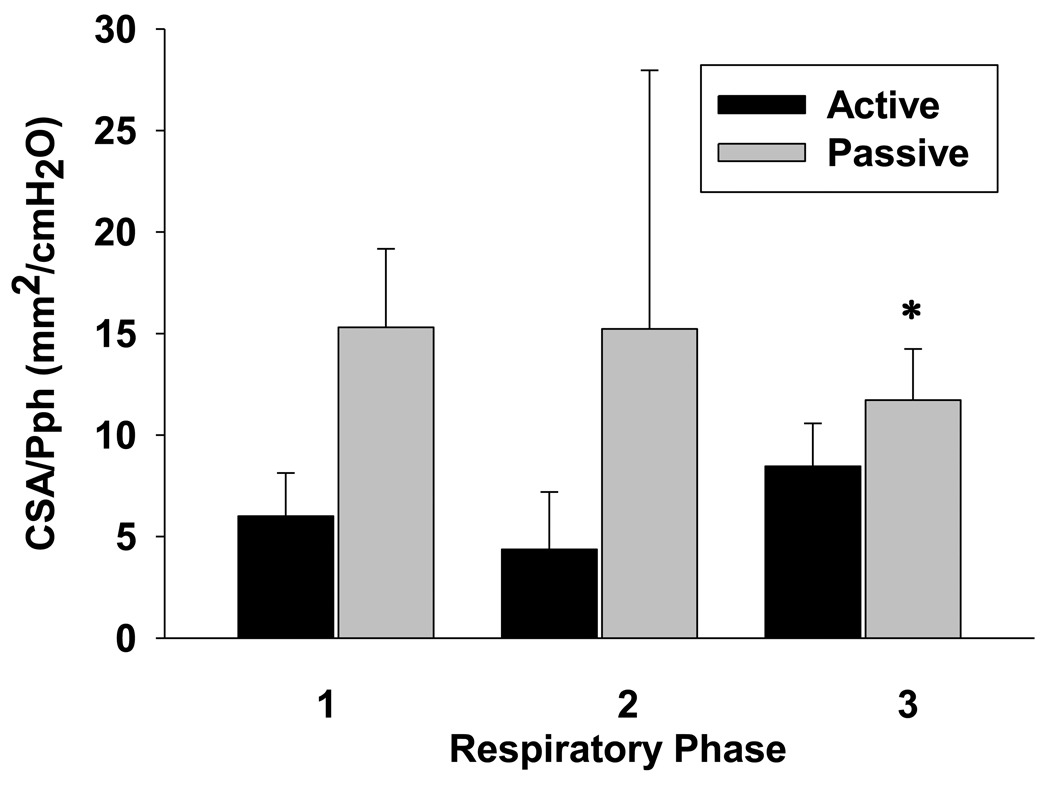
Figure 6.
Grouped data for CSA/Pph relationship during active and passive breaths (Phase 1: inspiratory; phase 2: post-inspiratory; and phase 3: expiratory, respectively). Note that the expiratory CSA/Pph relationship for passive (gray bars) was higher than for active breaths (black bars) on the same airway pressure (p<0.05). All presented data are mean ± SE.

