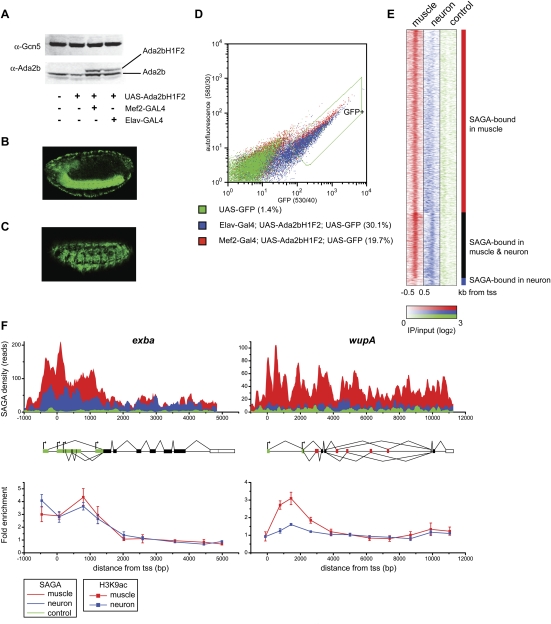
Figure 1.
(A) Western analysis of nuclear extract from Drosophila embryos probed with antibodies against Gcn5 and Ada2b. Extracts were isolated from OregonR (wild type, lane 1), UAS-Ada2bH1F2 in the absence of the GAL4 driver (lane 2), UAS-Ada2bH1F2 expressed under control of mef2-GAL4 (lane 3), and elav-GAL4 drivers (lane 4). (B) Lateral view of GFP expression in the ventral nerve chord and peripheral nervous system of a stage 15 elav-GAL4; UAS-Ada2bH1F2; UAS-GFP embryo. (C) Lateral view of GFP expression in somatic musculature of a stage 15 mef2-GAL4; UAS-Ada2bH1F2; UAS-GFP embryo. (D) GFP was plotted against yellow autofluorescence for single cells. GFP-positive nondebris events are shown within the green line (GFP+). The percentage of GFP-positive events is given in brackets beside each genotype. (E) Region map displaying the density of the SAGA ChIP-seq signal in muscle relative to neurons as IP/input (log2) for muscle-specific SAGA-bound genes (top panel), genes bound by SAGA in both muscle and neurons (middle panel), and genes bound by SAGA only in neurons (bottom panel). SAGA-binding density is shown for individual genes (rows) from −500 base pairs (bp) to +500 bp around the transcription start site (+1) in muscle (red) and neurons (blue) relative to the signal from a control Flag ChIP-seq experiment in untagged neuronal cells (green). (F) Binding profiles for SAGA (top panel) and acetylated H3-Lys9 (bottom panel) in muscle (red) and neurons (blue) are shown for the exba and wupA loci. The gene structure is indicated below the SAGA-binding profile: 5′ and 3′ UTRs are shown in green and white, respectively; constitutively and alternatively spliced exons are shown in black and red, respectively; and alternative transcription start sites are indicated by arrows. The Y-axis in the top panel represents the number of unique reads observed in two biological experiments for the SAGA ChIP-seq experiment for 20-bp windows across the two loci. The control profile in the top panel (green) represents the Flag ChIP-seq signal in untagged neuronal cells. ChIP for acetylated H3-Lys9 was performed on chromatin isolated from muscle and neurons. ChIP data represent mean percent input normalized to the coding region of a gene that is not expressed in embryos. Error bars denote standard error of the mean for three biological experiments.

