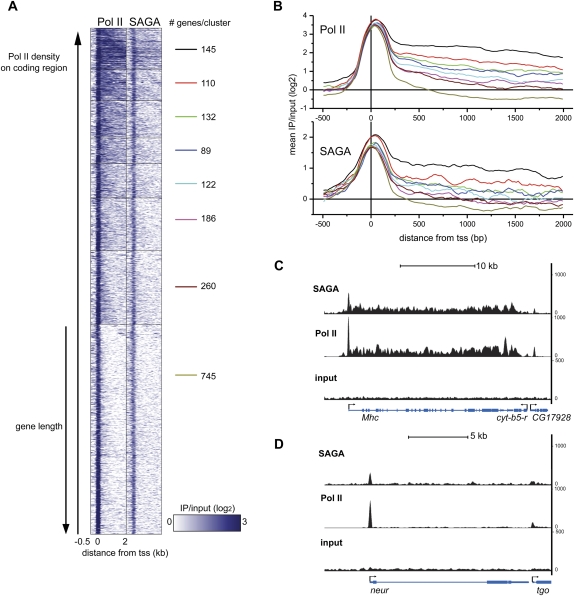
Figure 3.
(A) Region map displaying the density of Pol II and SAGA binding in muscle for genes bound by SAGA and Pol II that are longer than 500 bp. SAGA and Pol II binding is plotted from −500 bp to +2000 bp around the transcription start site (columns) as log2 ratios of IP/input. Pol II-bound genes in muscle were clustered into eight groups according to the density of Pol II on the coding region. The number of genes in each cluster is shown to the right of each cluster. Rows (genes) in each cluster were ordered by increasing gene length. (B) The mean Pol II (top panel) and SAGA (bottom panel) ChIP-seq signal intensity was plotted as log2 ratios of IP/input for each of the eight clusters described in A from −500 bp to +2000 bp around the transcription start site (+1). (C,D) Binding profiles for SAGA (top panel) and Pol II (middle panel) relative to input chromatin (bottom panel) are shown for the Mhc (C) and neur (D) loci. The Y-axis represents the number of unique reads observed in two biological experiments for the SAGA and Pol II ChIP-seq experiments.

