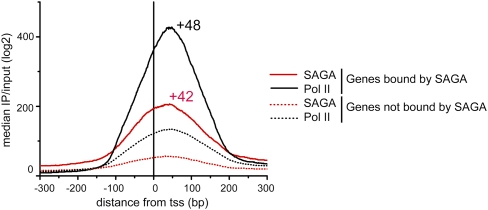
Figure 4.
The median log2 ratio of IP/input was plotted for SAGA (red) and Pol II (black) from −300 bp to +300 bp around the transcription start site at 639 SAGA-bound promoters, relative to 2455 promoters bound by Pol II that lack detectable levels of SAGA binding. The position of the peak summit relative to the transcription start site (+1) is shown above the graph for SAGA and Pol II.

