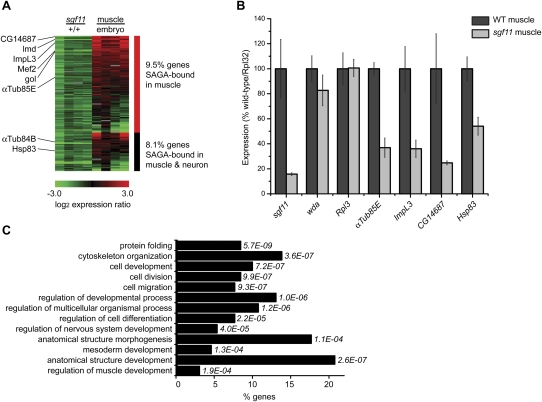
Figure 5.
(A) Heat map showing the log2 ratio of expression of SAGA-bound genes that are down-regulated in sgf11 muscle. Expression ratios are plotted for genes (rows) in sgf11 muscle relative to wild-type muscle, and wild-type muscle relative to dissociated cells from whole embryos. Ratios for four separate biological experiments are shown for each comparison. Genes bound by SAGA in muscle only are shown in the top panel (red bar), and genes bound by SAGA in muscle and neurons are shown in the bottom panel (black bar). (B) qPCR was performed on cDNA isolated from wild-type muscle (n = 5) and sgf11 muscle (n = 3) cells. Mean expression levels were normalized to Rpl32 and plotted as percentage wild type. Error bars denote standard error of the mean. (C) GO terms enriched in the set of SAGA-bound genes that are down-regulated in sgf11 muscle. The percentage of down-regulated SAGA-bound genes in each GO category is shown on the X-axis, with P-values shown to the right of each bar. Only a subset of GO terms that show differential enrichment in SAGA-bound sgf11 down-regulated genes are presented. A complete list of enriched GO terms with P-values <0.001 is provided in Supplemental Table 7.

