
Figure 1. LPS induces myocardial inflammation, transient LV dysfunction, and reduces myocardial FAO.
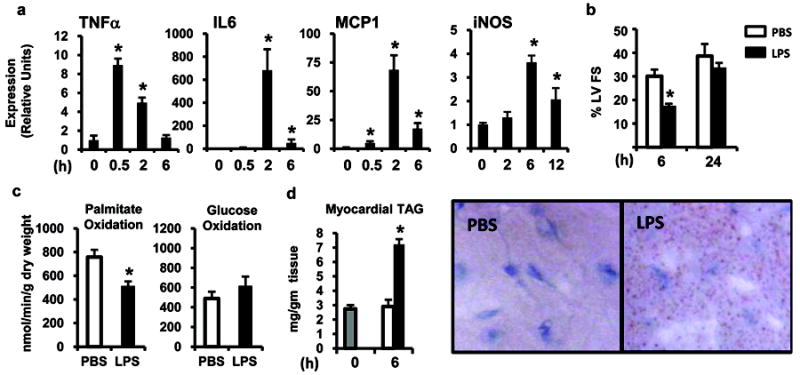
(a) C57BL/6 mice were injected with LPS (black bars) and gene expression of inflammatory cytokines in the myocardium was quantified by qRT-PCR at the indicated time points. All values were normalized to 36B4. For each timepoint, graph shows mean ± SE, n=4/group; * p≤ 0.05 compared to time 0. (b) C57BL/6 mice were injected with LPS (black bars) or PBS (white bars) and 2-D echocardiography was performed to determine left ventricular fractional shortening (%LVFS) at the indicated time points. For each timepoint, graph shows mean ± SE, n=4/group. (c) Myocardial palmitate and glucose oxidization rates were determined using an isolated working heart system 12h after the injection of LPS or PBS (n=6-8 mice per group). (d) Myocardial triglyceride (TAG) accumulation was assessed by direct quantification (left) and oil Red O staining (right) at baseline (gray bar) and 6h after LPS or PBS injection. For each timepoint, graph shows mean ± SE, n=4/group; * p≤ 0.05 for LPS vs. PBS injected (one-way ANOVA (a), repeated measures ANOVA (b), and Student’s t-test (c,d)).