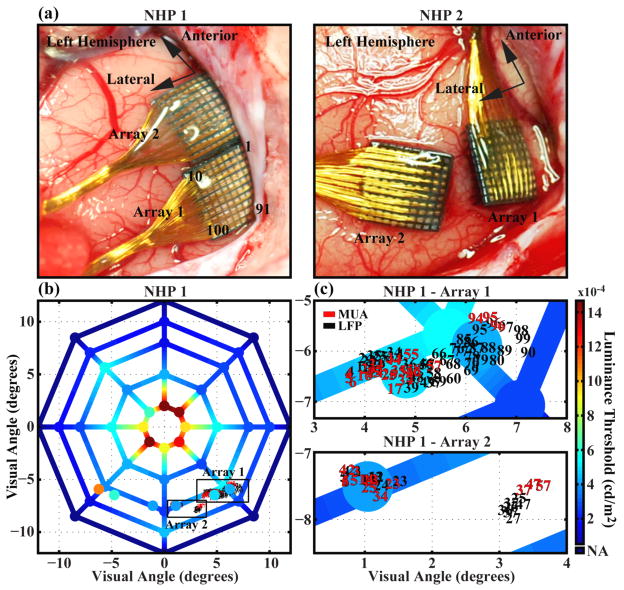
Figure 1.
Comparison of the anatomic and visuotopic locations of the electrode arrays and the spatial distribution of luminance thresholds across visual space for a behaving non-human primate. (a) Placement of arrays in cortex for NHP 1 and NHP 2. Arrays were placed in the left occipital cortex near the calcarine fissure and lateral to the sagittal sulcus for both animals. Electrode numbering scheme (with respect to lead wire location) is shown and is the same for all arrays. (b) Luminance threshold values obtained from NHP 1 for points across visual space. Values for spatial locations at the vertices of the plot were obtained before implantation of the arrays. Values located in the lower left and lower right quadrants of the plot that are not located at the vertices were obtained after the completion of all microstimulation experiments more than 290 days post-implantation. The center of the plot represents the fixation point. MUA-RF and LFP-RF center locations on each array are superimposed with the number indicating the electrode upon which they were recorded. (c) Enlarged views of the boxed regions in (b) showing RF center locations. Data was obtained from an experimental session five months post-implantation.

