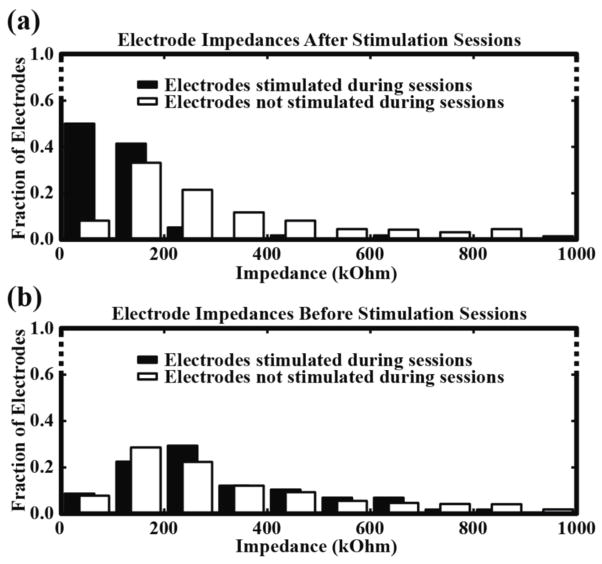
Figure 2.
Stimulated electrodes show a consistent drop in impedance after stimulation sessions. (a) Distribution of impedances after each stimulation session for electrodes that were stimulated (black) and those that were not stimulated (white). A significant decrease in impedance was observed for electrodes that were stimulated when compared to electrodes that were not stimulated. Data was taken from eight sessions and consisted of 58 stimulated and 710 non-stimulated electrodes. (b) Post-stimulation impedances increased by the next stimulation session and the distribution of impedances was not significantly different when compared to impedances from electrodes that were never stimulated.

