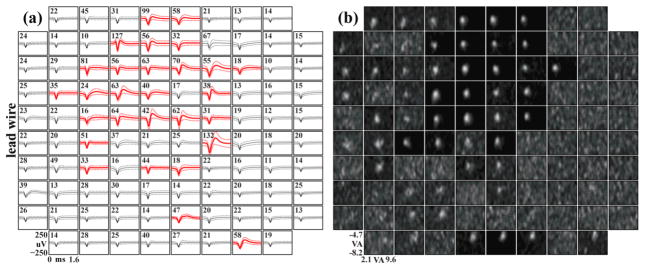
Figure 3.
Across multiple recording sessions, the largest MUA was mostly localized to the upper-middle region of the array. This region correlated with the region where robust MUA-RFs were observed. (a) Largest MUA for each electrode compiled from 19 recording sessions spanning 6 months. Waveforms were extracted from full-bandwidth (30 kS/sec), high-pass filtered (250 Hz) neural recordings using a 100 μV threshold crossing. The mean waveform for each electrode was then calculated from these extracted waveforms. Mean waveforms with a peak-to-peak amplitude greater than 125 μV are shown in bold red. Firing rate in Hertz is shown in the upper left corner of each box. (b) RFs generated using reverse correlation. Each box represents a region of visual space vertically from −4.7 to −8.2 visual degrees and horizontally from 2.1 to 9.6 visual degrees with the fixation point near the upper left corner. Data came from an experimental session five months post-implantation in NHP 1 Array 1.

