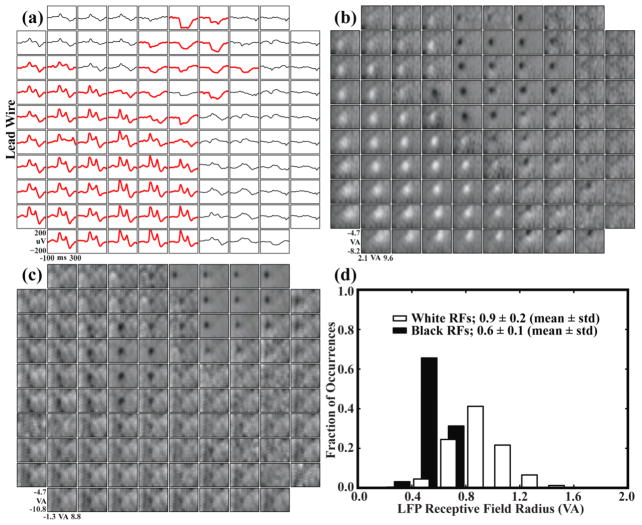
Figure 4.
Visually-evoked LFP recordings and LFP-RFs demonstrated an amplitude phase reversal across the array. The region of the array with negative-going LFP responses correlated with the region where the largest MUA was observed. (a) Largest visually-evoked LFP for each electrode compiled from ten recording sessions spanning three months. Each waveform represents the average of ~50 LFP responses to a visual stimulus. Responses with a peak-to-peak amplitude greater than 75 μV are shown in bold red. Stimulus onset occurred at time zero. A shift from a positive to a negative-going response can be seen when moving diagonally across the array. (b) Each box represents a region of visual space vertically from −4.7 to −8.2 visual degrees and horizontally from 2.1 to 9.6 visual degrees with the fixation point near the upper left corner. Pixel intensities represent the area under the evoked LFP response for a stimulus at that location in visual space. White RFs were generated from positive-going LFP responses and black RFs from negative-going responses. (c) LFP-RFs across Array 2. An amplitude phase reversal was not observed for this array. (d) LFP-RF sizes for Array 1 compiled from ten recording sessions over three months and separated into black (negative-going LFP) versus white (positive-going LFP) responses. RFs were fit to a Gaussian curve, and the radius represents the standard deviation of the fit. Black RFs were significantly smaller than white RFs.

