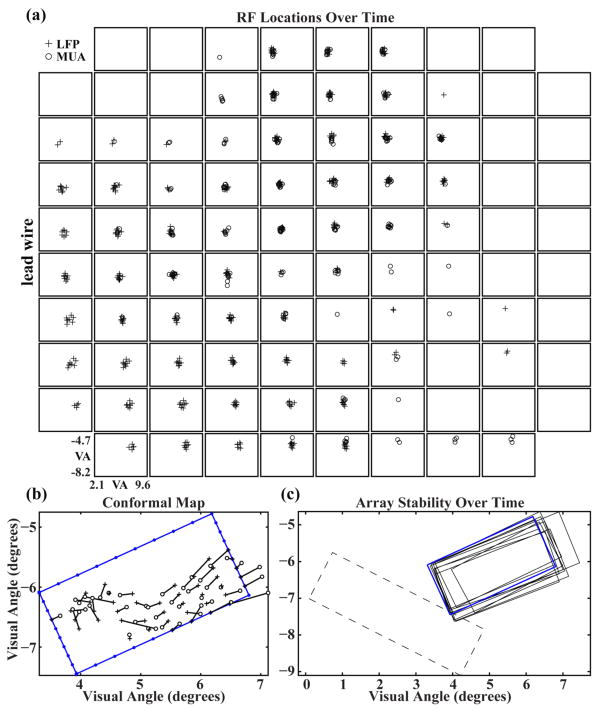
Figure 5.
RF centers are stable over time and occupy distinct regions of visual space for different electrodes across the array. The location of the array in visual space remains stable over time. (a) MUA-RF and LFP-RF centers for each electrode taken from ten recording sessions spanning 97 days. The spatial variance for all MUA and LFP centers is 0.2 ± 0.1 (mean±std) visual degrees. (b) Least-mean-squared-error fit of a conformal transformation of the electrode array geometry to the locations of the RF centers associated with their respective electrodes. Data was collected 148 days after implantation in NHP 1 on Array 1. The blue rectangular outline with small, filled circles represents the electrode array as mapped into visual space with each symbol indicating the location of an electrode along the periphery of the array. The large filled diamond and filled square on the left corners of this outline represent electrode sites at the most anterolateral and anteromedial corners of the array, respectively. Crosses represent the conformal geometry of the electrode array transformed into a visual space representation. Each cross is connected to an open circle that represents the mapped RF center of that electrode. (c) Solid outlines represent Array 1 position in visual space over 97 days of recording. Outlines were generated from LFP-RF data using the method described in (b). The blue outline represents the fit from the data shown in (b). The dashed outline shows the position of Array 2 for a single recording session.

