Figure 6.
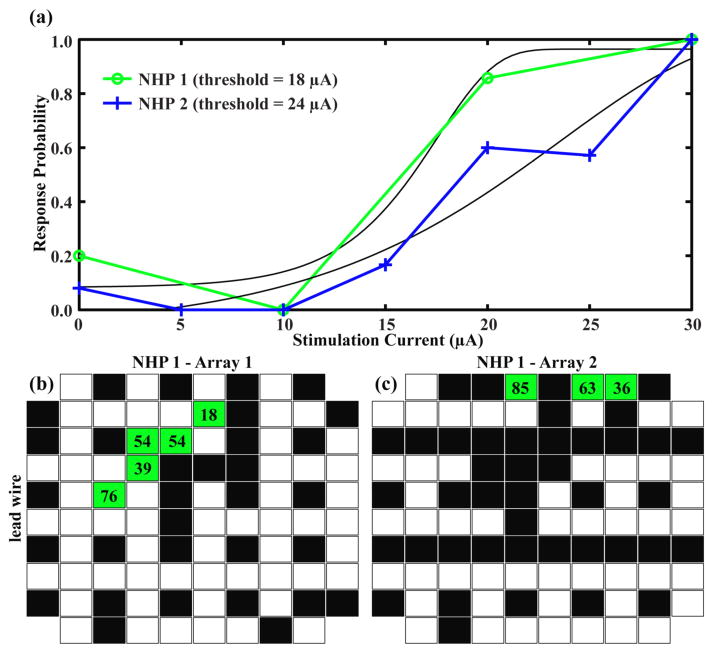
Effective microstimulation occurred on electrodes in the same region of the array where the largest MUA and the negative-going visually-evoked LFP responses were recorded. (a) Behavioral responses to microstimulation of a single electrode in each of two NHPs. Each data point represents the average of ~5 yes/no responses to that level of stimulation. Stimulation parameters for both animals consisted of a train of 40 cathodic-first pulses of width 200 μs and frequency 200 Hz. The green psychometric curve was generated from data collected from NHP 1 by stimulation via electrode 15 on Array 1. The blue psychometric curve was generated from data collected from NHP 2 by stimulation via electrode 56 on Array 1. Black curves are the non-linear fits of the Weibull function to the data. Thresholds are taken at the 50% response probability. (b) Distribution of stimulated electrodes and the resulting behavioral responses across Array 1 for NHP 1. Black boxes represent electrodes that were stimulated up to 96 μA and did not elicit a behavioral response. Green boxes show electrodes that generated psychometric curves in response to stimulation. The numbers in each box represent the lowest current threshold acquired for that electrode. White boxes were never stimulated. (c) Same plot as (b) for NHP 1 Array 2.

