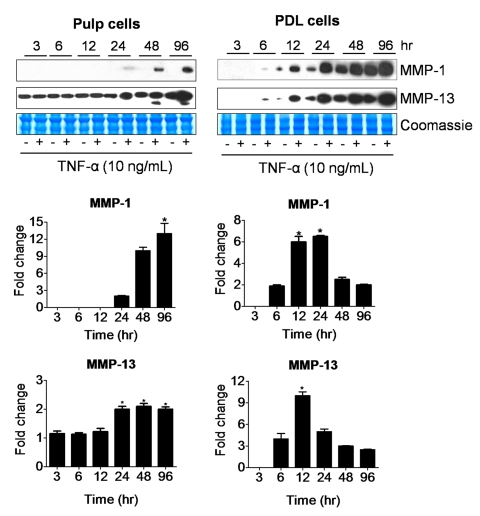
Figure 2.
Time-course effects of TNF-α on MMP-1 (55 kDa) and MMP-13 (60 kDa) secretion by dental pulp and PDL cells. Western immunoblots are representative of conditioned medium samples from cells treated with 10 ng/mL of TNF-α for 3, 6, 12, 24, 48, and 96 hrs. Coomassie blue staining shows equal loading for all lanes. Graphs represent fold-change in expression of MMP-1 and MMP-13 adjusted to baseline levels for dental pulp and PDL cells. Graphs depict mean and standard deviation from 3 different cell donors; *p < 0.05.

