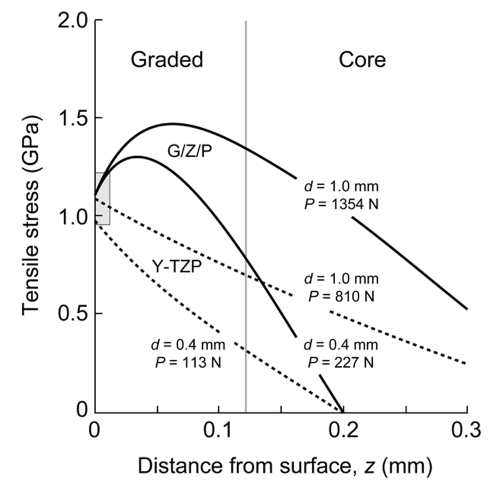
Figure 4.
Stress distributions in G/Z/G and Y-TZP plates subject to flexural loading from contact with a hard sphere at the top surface, as a function of distance z from tensile surface. Curves calculated from FEA for each specimen thickness, at breaking loads measured experimentally (mean for n = 6 per specimen type).

