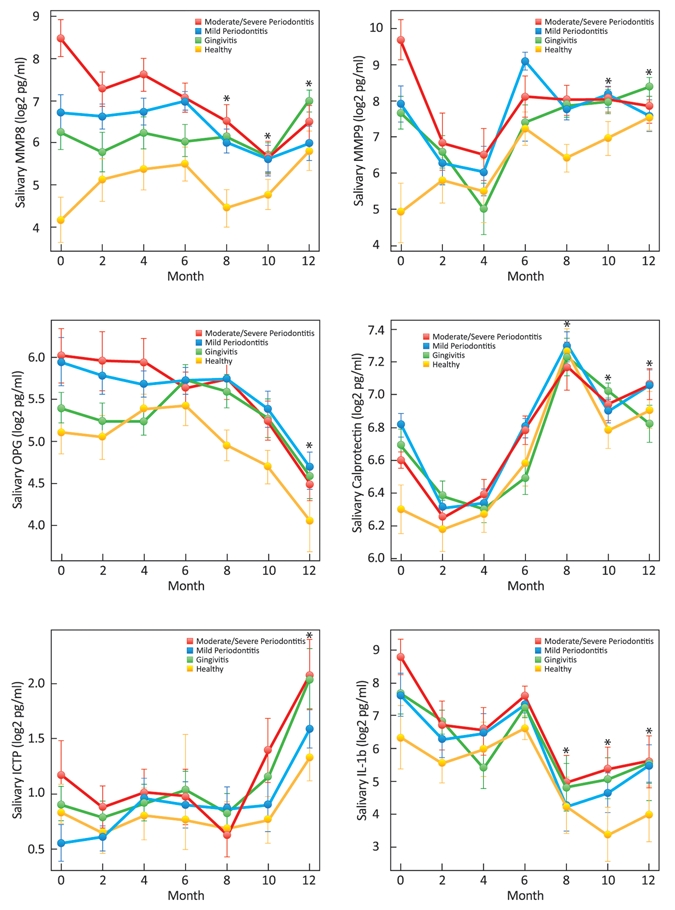
Figure 3.

Longitudinal plots of mean (± SD) salivary biomarker levels stratified by initial category of periodontal health. Compared with baseline, significant reductions in salivary MMP-8 were seen in the moderate/severe periodontitis group at 8, 10, and 12 mos; those in the healthy group showed significant increases in MMP-8 levels at 12 mos (p < 0.05). Participants in the moderate/severe periodontitis group had significant reductions in MMP-9 at 10 and 12 mos compared with baseline; those in the healthy group had significant increases in MMP-9 at 10 and 12 mos compared with baseline (p < 0.05). Individuals in the periodontitis group had significant reductions in salivary OPG levels at 12 mos compared with baseline (p < 0.05). Compared with baseline levels of calprotectin, participants in the moderate/severe periodontitis group showed significant increases at 8, 10, and 12 mos; those in the mild periodontitis group had increases at 8 and 12 mos; those in the gingivitis group had increases at 8 and 10 mos; and those in the healthy group had increases at 8, 10, and 12 mos (p < 0.05). Significant increases in salivary ICTP were observed in the mild periodontitis and gingivitis groups at 12 mos compared with baseline (p < 0.05). Compared with baseline, significant decreases in IL-1β levels were seen in the periodontitis groups at 8, 10, and 12 mos, in the gingivitis group at 8 and 10 mos, and in the healthy group at 10 mos (p < 0.05).
