
Figure 4.
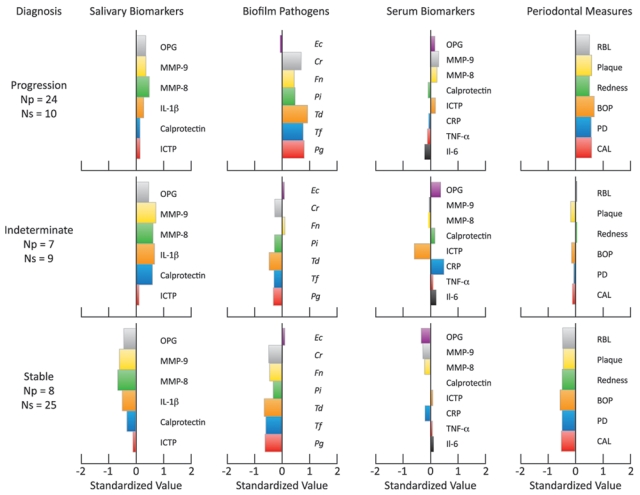
Barplots displaying three clusters based on levels of salivary biomarkers, biofilm, serum biomarkers, and clinical measures. Within each cluster, the number of participants undergoing disease progression (≥ 2 sites demonstrating > 2 mm of CAL loss over 6 mos) is indicated. Np = number of participants within each group experiencing disease progression. Ns = number of participants within each group without disease progression.