Figure 4.

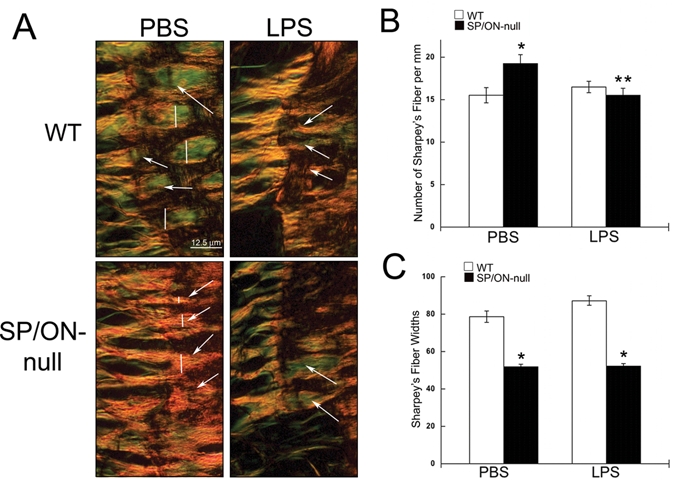
SP/ON-null PDL exhibited thinner Sharpey’s fibers (SF) in greater numbers. (A) High magnification of the PDL-bone interface allowed for visualization of SF. In PBS-injected sites, SF were thicker in WT than in SP/ON-null mice; however, greater numbers of SF were present in SP/ON-null mice. (B) Quantification showed that PBS-injected sites of SP/ON-null mice have the greatest number of SF. * indicates p < 0.05 SP/ON-null PBS vs. WT PBS; ** indicates a significant difference, p < 0.05, in LPS- vs. PBS-injected sites in SP/ON-null mice, as determined by Student’s t test. Error bars = SEM. (C) Quantification of SF widths showed that SP/ON-null mice had thinner SF in comparison with the SF in WT mice. * indicates a significant difference, p < 0.05, between SF thickness in SP/ON-null vs. SF in WT mice, as determined by Student’s t test. Error bars = SEM.
