Figure 1.

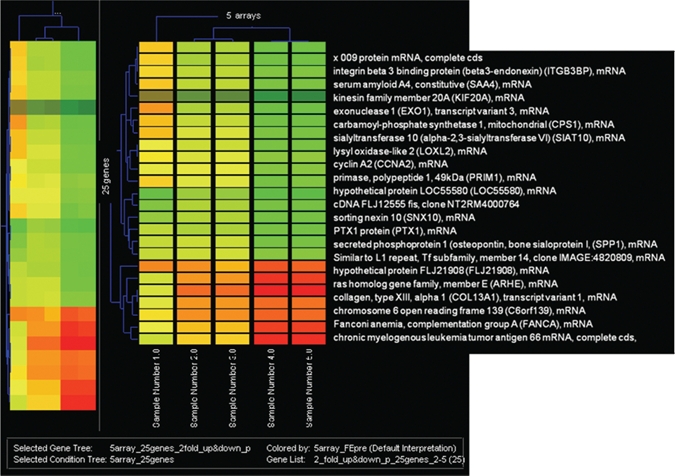
Hierarchical gene cluster analysis of ameloblastoma. Each column represents a tumor sample and each row a single gene. Gene expression levels are shown in descending order; red indicates two-fold up; green, two-fold down.

Hierarchical gene cluster analysis of ameloblastoma. Each column represents a tumor sample and each row a single gene. Gene expression levels are shown in descending order; red indicates two-fold up; green, two-fold down.