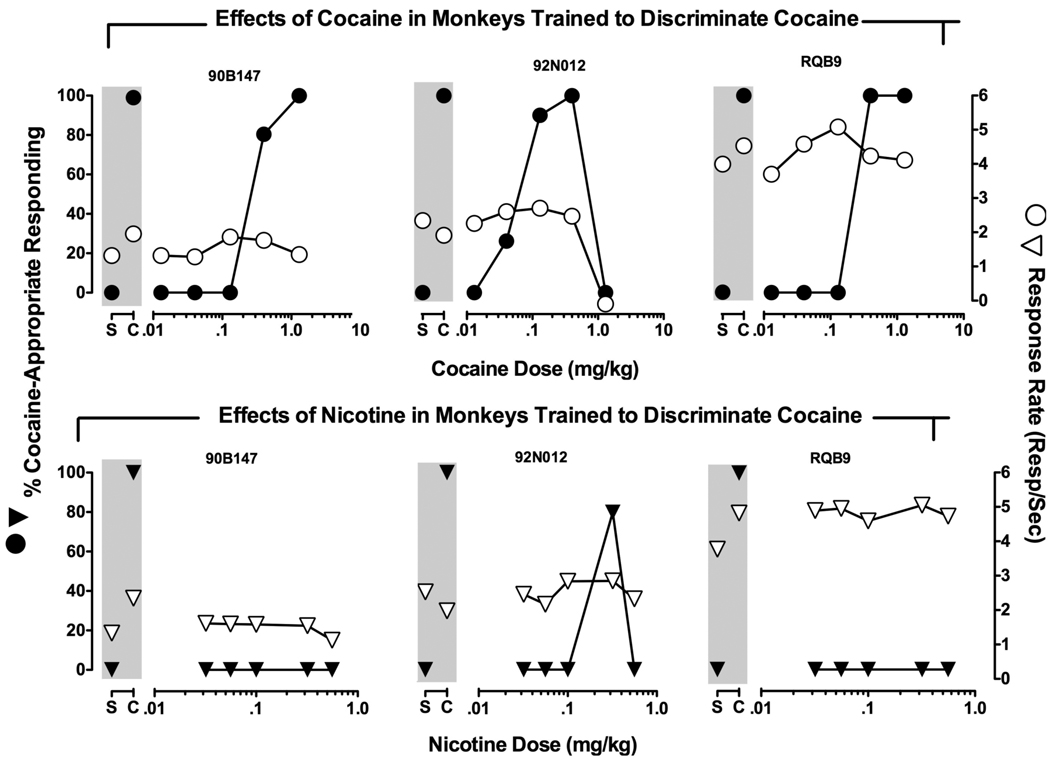
Figure 1.
Cumulative dose-effect curves for cocaine (●, upper panels) and for nicotine (▼, lower panels) in three individual monkeys trained to discriminate 0.4 mg/kg cocaine from saline. Abscissae: Cocaine (Upper panels) and nicotine (Lower panels) dose in mg/kg (log scale). Left ordinates (Filled symbols): % Cocaine-appropriate responding. Right ordinates (Unfilled symbols): Response rate (responses/second). Data points above “S” and “C” show control data from saline and cocaine training cycles, respectively. Each point represents one determination at each dose. Each monkey’s identification number is located above the figures.

