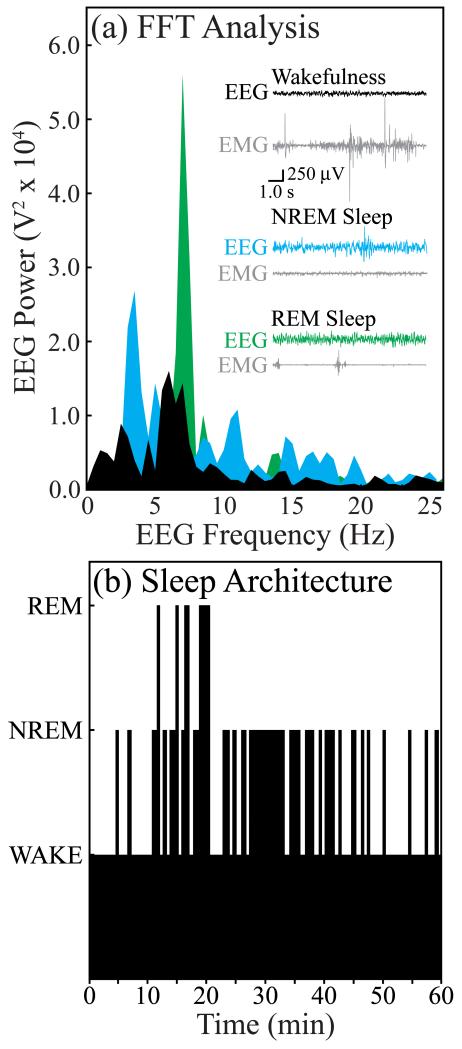
Figure 3.
Electrographic identification of sleep and wakefulness. (a) Representative 10-s recordings of cortical EEG and electromyogram (EMG) as well as a fast Fourier Transform of the respective EEG signals are shown for wakefulness (black), NREM sleep (blue), and REM sleep (green). (b) A time-course plot of sleep architecture during a typical experiment. The height of the black bars indicates the behavioral states of wakefulness (lowest bars), NREM sleep (intermediate height bars), or REM sleep (highest bars). Data shown in (a) and (b) were obtained from the same rat.

