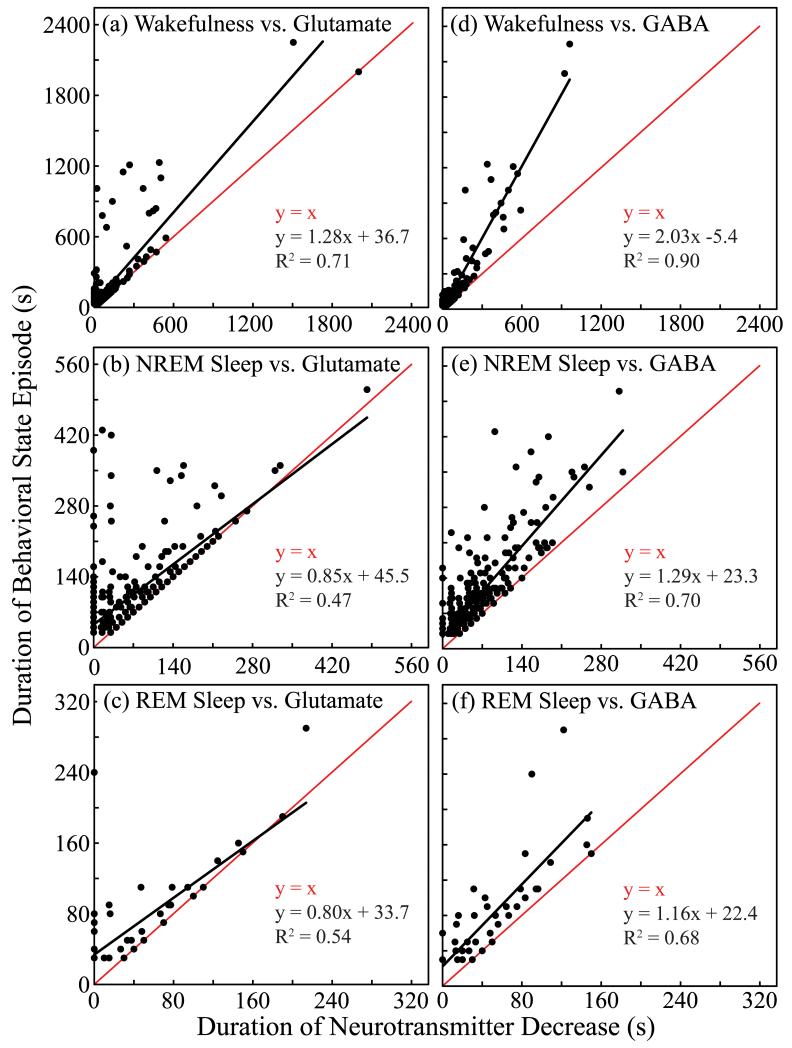
Figure 6.
Duration of behavioral state episode varied as a function of duration of the decrease in concentrations of glutamate and GABA. Each plot indicates that for both glutamate (a-c) and GABA (d-f), the lower-level phenotype of duration of amino acid decrease (abscissa) accounted for a significant amount of the variance in the higher-level phenotype of behavioral state duration (ordinate). Black line plots y as a function of x; red line plots the line of identity. (b, c, f) Slopes of the black line near or less than the slope of the line of identity (red line) indicate that the longer the decrease in amino acid concentration, the longer the duration of NREM sleep (b) or REM sleep (c and f).

