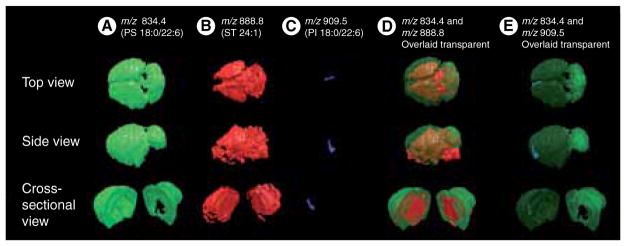
Figure 2. 3D models of mouse brain created with desorption ESI-mass spectral imaging.
3D constructions show the distributions of
(A) phosphatidylserines (PS) 18:0/22:6 in green, (B) sulfatides 24:1 in red, and (C) phosphatidylinositols 18:0/22:6 in blue. Overlaid distributions are shown for lipids (D) PS 18:0/22:6 and sulfatides 24:1, and (E) PS 18:0/22:6 and phosphatidylinositols 18:0/22:6.
Reprinted with permission from [1].

