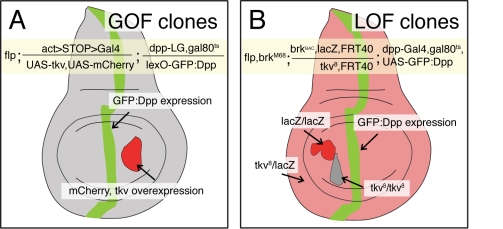
Figure 2. Analysis of the Dpp gradient in GOF and LOF receptor mutant clones.
Sketches of 3rd instar wing imaginal discs containing GOF (A) and LOF (B) receptor mutant clones. In both cases the Dpp gradient is visualized by expressing a GFP:Dpp fusion protein within its endogenous domain. In the GOF situation, we used the Lex-A binary expression system to express GFP:Dpp, and in the LOF situation we used the Gal4 binary expression system. Genotypes are described in the yellow boxes and in the Materials and Methods section. GOF clones are marked by co-expression of mCherry; LOF clones are marked by the loss of arm-lacZ or ubi-nGFP expression. In the clonal experiments where we analyzed the endogenous Dpp gradient by pMad or Sal stainings, GFP:Dpp was not expressed.

