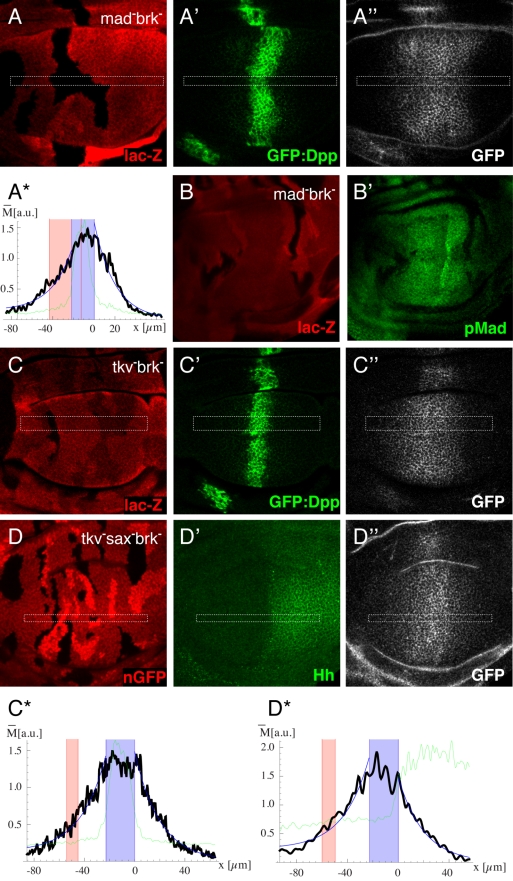
Figure 4. Effect of receptor LOF clones on the Dpp gradient is consistent with the restricted diffusion model.
Third instar wing imaginal discs with LOF clones for Mad brk (A,B), tkv brk (C), and tkv brk in a sax mutant background (D). Receptor mutant clones are indicated by the loss of lac-Z staining (A,B,C) or nGFP (D). (B) Analysis of Dpp signaling activity by pMad staining (B′). (A,C,D) Analysis of the Dpp gradient. GFP:Dpp is visualized directly (A′,C′) and by antibody staining (A″, C″, D″). While GFP antibody staining in (D) did not interfere with the nuclear GFP clone-marker (see Materials and Methods), direct visualization of GFP:Dpp was not possible in this genotype. In order to estimate the region of Dpp production in this genotype, we visualized the A-P boundary by Hh antibody staining (D′). (A*,C*,D*) Intensity plots of the marked regions of the corresponding immunofluorescence images. The green line represents the GFP:Dpp (A,C) or Hh (D) signal, and the black line represents the intensities of the GFP antibody staining. The Dpp production region is indicated in blue, and the clone region in red. The position x is expressed in µm and the extracted Dpp levels in arbitrary units. None of the genotypes lead to a significant effect on the Dpp gradient. Therefore the data contradict the RMT scenario and coincide with the RED scenario in which the majority of Dpp is external-unbound.

