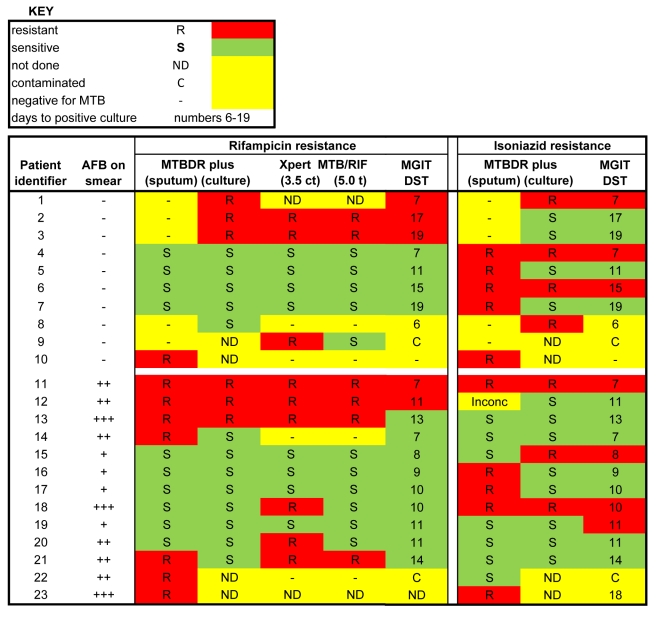
Figure 2. Heat map showing drug susceptibility profiles from 23 samples based on Xpert MTB/RIF, MTBDRplus on sputum, MTBDRplus on cultured isolates, and phenotypic culture (MGIT DST).
The 23 samples were from a cohort of 311 participants. The heat map shows samples represented in rows and assigned numerical patient identifiers and testing methodologies in columns. Three colors are used to indicate the results: red, resistant; green, sensitive; yellow, not done, negative for M.tb, contaminated, or inconclusive. The samples are sorted into AFB-negative or -positive, with RIF and INH profiles in blocks side by side. Two columns are shown for the RIF results generated from the Xpert MTB/RIF using the amplification cycle threshold maximums 3.5 and 5.0. MDR TB was identified in two patients.

