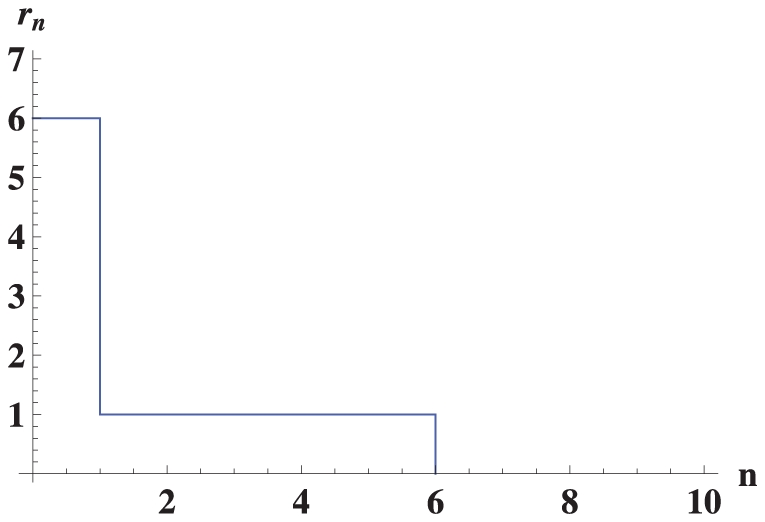
Figure 2. Fitness  versus Hamming distance
  from the peak sequence for the truncated fitness landscape.

 versus Hamming distance
  from the peak sequence for the truncated fitness landscape.