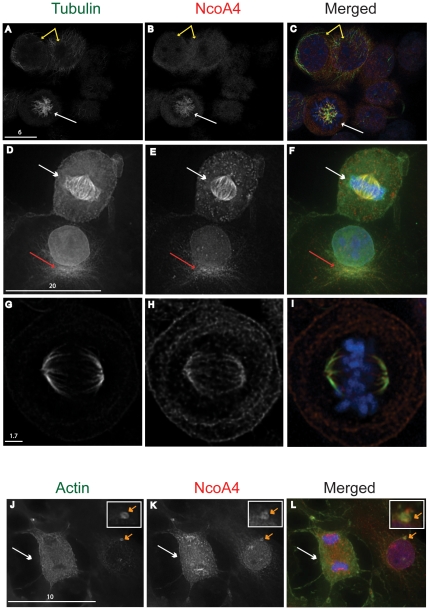
Figure 2. Co-localization of NcoA4 with tubulin and actin.
T47D (A to C and G to I) or COS (D to F and J to L) cells were stained for NcoA4 and either α-tubulin (A to C), β-tubulin (D to F), acetylated tubulin (G to I) or actin (J to L). Cells were subjected to DAPI staining for visualization of chromatin (blue). Shown are representative images of non-mitotic cells (A to C, yellow arrow) and cells undergoing cell division (prophase: A to C, metaphase: D to I, and anaphase: J to L, white arrows). An aster formation is shown in D to F (red arrow). Yellow staining indicates overlapping NcoA4 and tubulin or actin (inset; orange arrow) localization. All images shown are of single optical slices obtained by confocal (A to C and G to I) or deconvolution (D to F and J to L) microscopy. [Bars are 1.7 µm-20 µm as indicated].

