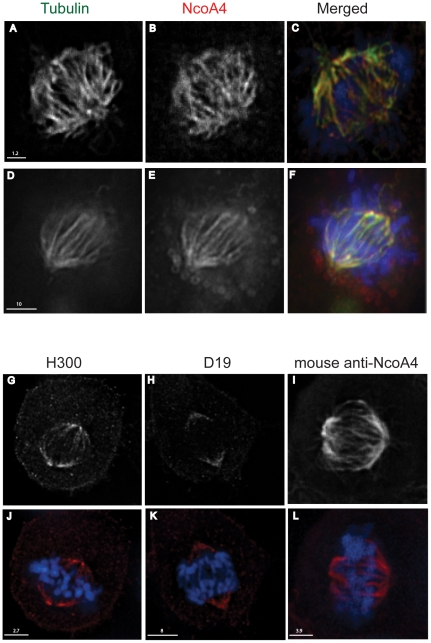
Figure 5. Co-localization of NcoA4 and α-tubulin in mammalian cell lines using various NcoA4 antibodies.
COS (A to C) and ES2 (D to F) cells stained for NcoA4 (red) and α-tubulin (green) and examined by confocal and deconvolution microscopy, respectively. These images were generated using a rabbit polyclonal antibody raised against the first 300 amino acids (H300) of NcoA4. Panels G and J: COS cells stained for NcoA4 (red) using H300 antibody. Panels H and K: COS cells stained for NcoA4 (red) using a goat polyclonal antibody (D19). Panels I and L: T47D cells stained for NcoA4 using a mouse monoclonal antibody. Cells were also subjected to DAPI staining for visualization of chromatin (blue). Images shown in panels G to L were generated by confocal microscopy and are of representative cells undergoing metaphase. All images shown are of single optical slices. Yellow immunostaining indicates co-localization of NcoA4 with α-tubulin [Bars are 1.2 µm-10 µm as indicated].

