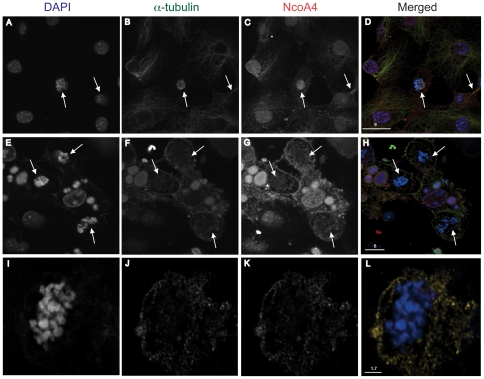
Figure 7. Co-localization of NcoA4 and α-tubulin in COS cells treated with nocodazole.
COS cells untreated (A to D) or treated with 100 ng/ml nocodazole for 12 hours (E to L) were stained for NcoA4 (red) and α-tubulin (green) and examined by confocal microscopy. Cells were also subjected to DAPI staining for visualization of cell nuclei (blue). Yellow staining indicates NcoA4-α-tubulin co-localization. Images shown are of single optical slices. Arrows indicate mitotic figures. [Bars are 1.7 µm-9 µm as indicated].

