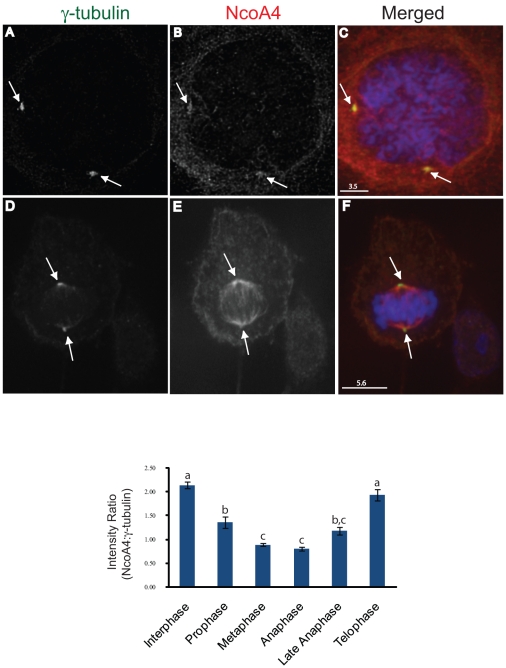
Figure 9. Dynamic changes of NcoA4 association with the centrosome during mitotic progression.
COS cells were stained for NcoA4 (red; B and E), and γ-tubulin (green; A and D) and examined under confocal microscopy. Merged images are shown in C and F and all images shown are of single optical slices. Cells were also subjected to DAPI staining for visualization of chromatin (blue). The immunofluoresence intensity of centrosomal NcoA4 and γ-tubulin at different mitotic stages was determined by image analysis and the ratio summarized in the bar graph for cells at different stages of cell division. Data are presented as mean ± SEM of 27–147 centrosomes per group. Bars with different letters are statistically different from one another as determined by Kruskal Wallis ANOVA for Ranks followed by Dunn's multiple comparison method (p<0.05). [Bars are 3.5 µm and 5.6 µm as indicated]

