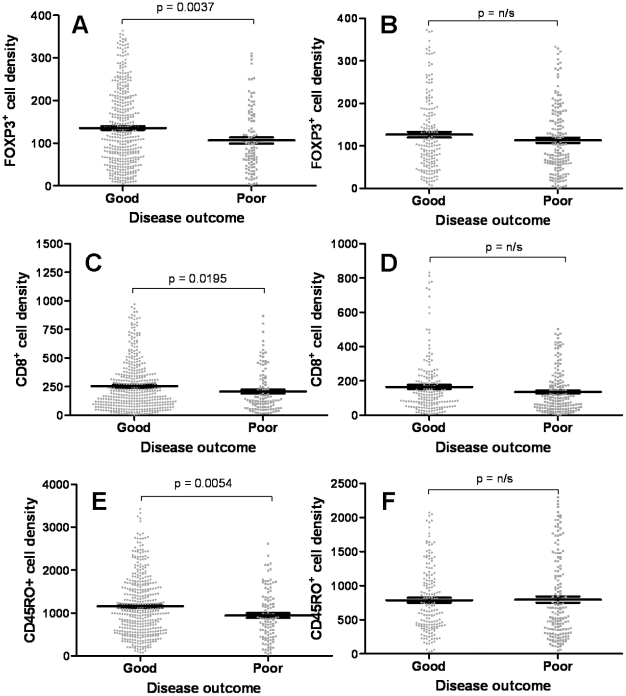
Figure 6. T cell density and disease outcome.
When dividing the patients into good and poor disease outcome, FOXP3 expression was significantly greater in patients with a good disease outcome in (A) stage II CRC but not in (B) stage III CRC. Similarly, CD8 was also significantly greater in patients with a good disease outcome in (C) stage II CRC but not in (D) stage III, as with CD45RO in (E) stage II and (F) stage III. Each dot represents one patient and the bars represent the median value ± SE.

