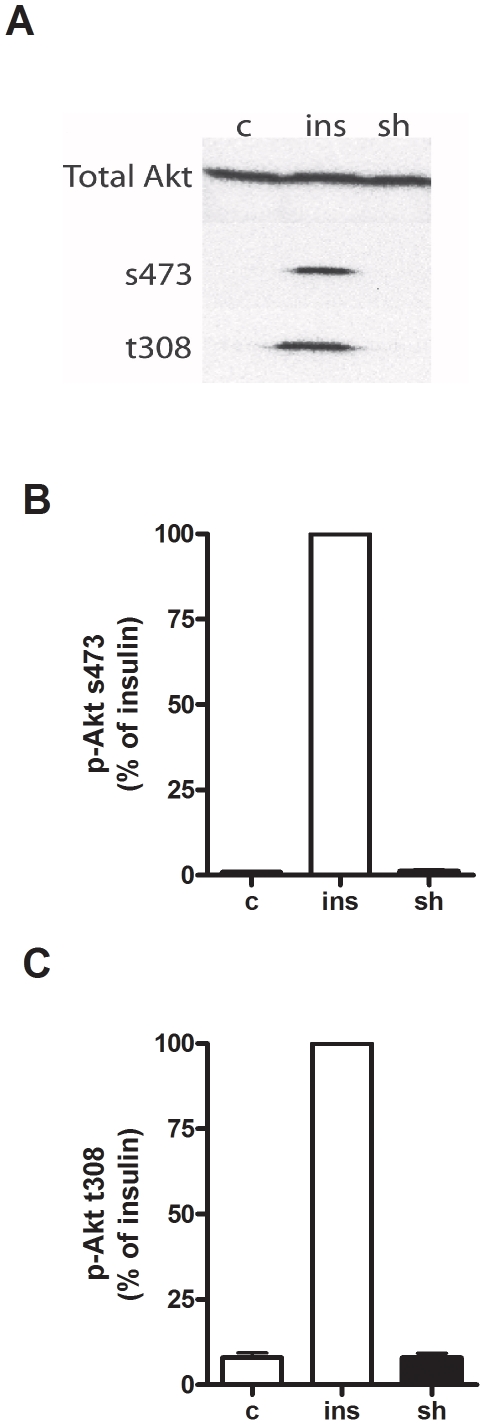
Figure 2. Akt-phosphorylation in response to shikonin and insulin.
(A) Immunoblot of total Akt or phosphorylated Akt at serine 473 (s473) or threonine 308 (t308) following treatment of L6 myotubes with water as control (c) or stimulated with either 1 µM shikonin (sh) or 1 µM insulin (ins) for 2 h. Figure is representative of three independent experiments performed. (B) and (C) show quantification of immunoblots expressed as a percentage of the response to 1 µM insulin (ins) for 2 h.

