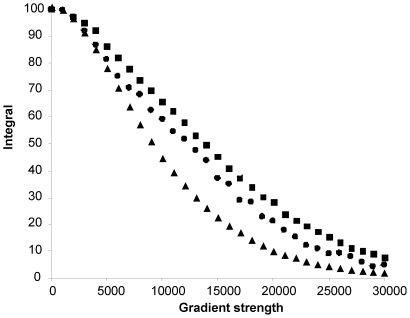
Figure 3. NMR diffusion data.
The plot reports the integral of an envelope of signals (y-axis) against the applied gradient strength (x-axis). The symbols correspond to the IscS dimer (grey squares), proNGF25 (black squares), DHFR (grey diamonds), NGF (black circles) and the NusA KH domain (black triangles). For each protein, the peak integrals were plot against the applied gradient strength.

