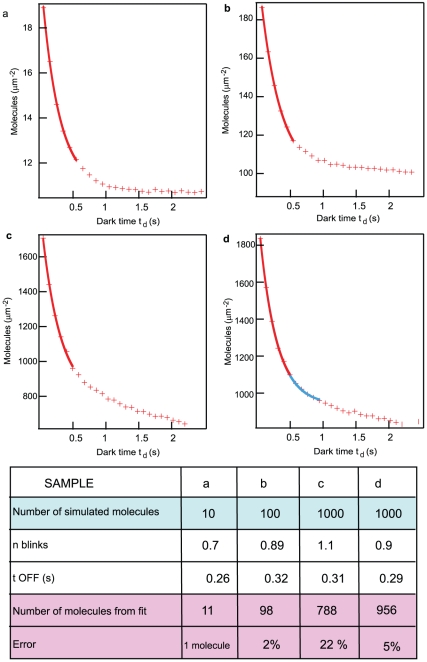
Figure 2. Semi-empirical fit to simulated data.
Simulated PALM experiments on in-silico samples generated at three different densities while keeping the photophysical parameters constant. a) 10, b) 100 and c) and d) 1000 molecules/µm2 . The simulated counts curves are fitted to equation (1), using only the first 5 points of the curve, up to a td = 50*10 ms = 0.5 s. a) 10 molecules/µm2 we observe an error of 1 particle/µm2 between the value extracted from the fit and the number of molecules present in the in-silico experiment, b) 100 molecules/µm2 we observe an error of 2% that goes up to c) 20% at 1000/µm2. However, upon reducing the photoactivation power in the densest sample d) this error reduces to approximately 5%. By reducing the photoactivation rate of a factor three, the fit can be extended (blue curve) up to 30 photoactivation cycles obtaining an error of 7%.

