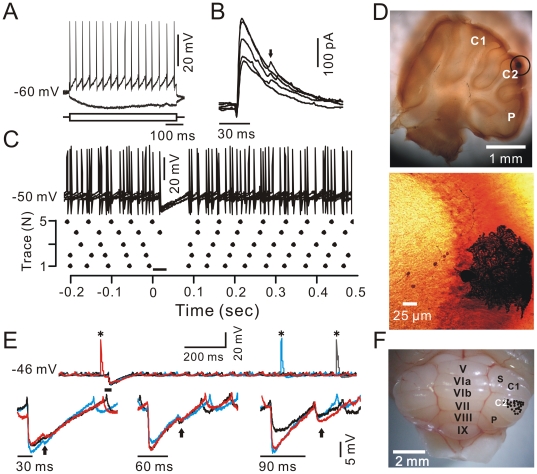
Figure 1. PC somata and dendrites in response to tactile stimulation.
A, Whole-cell patch-clamp recording from a soma of a PC in response to hyperpolarizing (–100 µA) and depolarizing (+100 µA) current pulses. B, Under voltage-clamp (Vhold = –70 mV), superposition of five sweeps shows the effects of tactile stimuli (bar, 30 ms) on PC membrane currents. Notably, 3/5 IPSC traces expressed a second peak (arrow) at ∼30 ms after the first peak. C, Under current-clamp conditions (I = 0), superposition of five sweeps (upper) and the raster plot of simple spike events (lower) show how the PC responds to tactile stimuli (bar, 30 ms). D, The photomicrographs show the morphology of the cell, which is shown in A–C. The left column shows an overview of the location of the biocytin-labeled cell, which is indicated with a black circle. The right column shows the detail of the biocytin-labeled cell. E, Under current-clamp (I = 0), a representative dendritic patch-clamp recording shows the response of the PC dendrite to tactile stimuli. Upper, superposition of five sweeps presenting the dendrite in response to tactile stimuli (bar, 30 ms). Asterisks indicate complex spikes. Lower, superposition of three sweeps showing the different durations (30 ms, 60 ms, and 90 ms) of tactile stimulation-induced responses in the dendrites. Arrows indicate the offset responses. F, Ex vivo image of cerebellum with lobules indicated by letters, C1 is Crus I, C2 is Crus II; P, paramedian lobules; S, simple lobule. The overall distribution of the recorded PCs in this study is indicated by black circles; it is located in Crus II.

