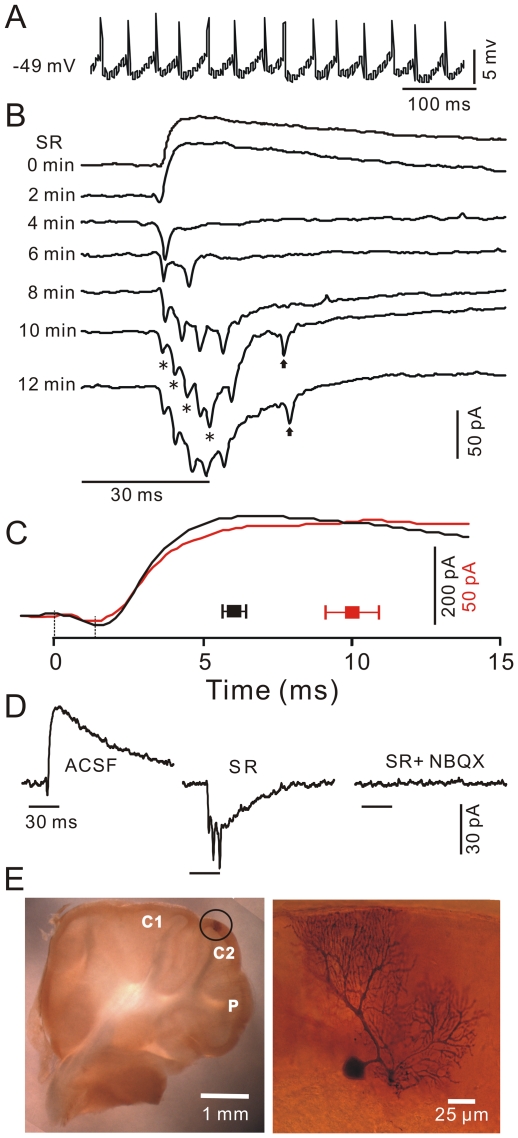
Figure 4. Pharmacological properties of PC dendrites in response to tactile stimulation.
A, Under current-clamp (I = 0), a PC dendritic patch-clamp recording demonstrates the spontaneous attenuated simple spike activity. B, Under voltage-clamp (Vhold = −70 mV), the effects of SR95531 (20 µM) on the tactile stimulation (bar, 30 ms)-evoked dendritic responses are shown. Asterisks denote the summation of PF-EPSCs. Arrows indicate the responses induced by stimulation offset. C, Representative current traces and mean values (± SEM) of the time to peak of the responses show the difference between the somata (black; n = 12) and dendrites (red; n = 19) in response to tactile stimulation. The time point (0) indicates the onset of the responses. The vertical scale denotes 200 pA (black) for the soma and 50 pA (red) for the dendrite, respectively. D, Under voltage-clamp (Vhold = −70 mV), the PC dendrites' response to tactile stimuli in ACSF, with SR95531, and with a mixture of SR95531 and NBQX is shown. (E) The photomicrographs depict the morphology of the recorded cell. The left column shows an overview of the location of the biocytin-labeled cell, which is indicated with a black circle. The right column shows the detail of the biocytin-labeled cell.

