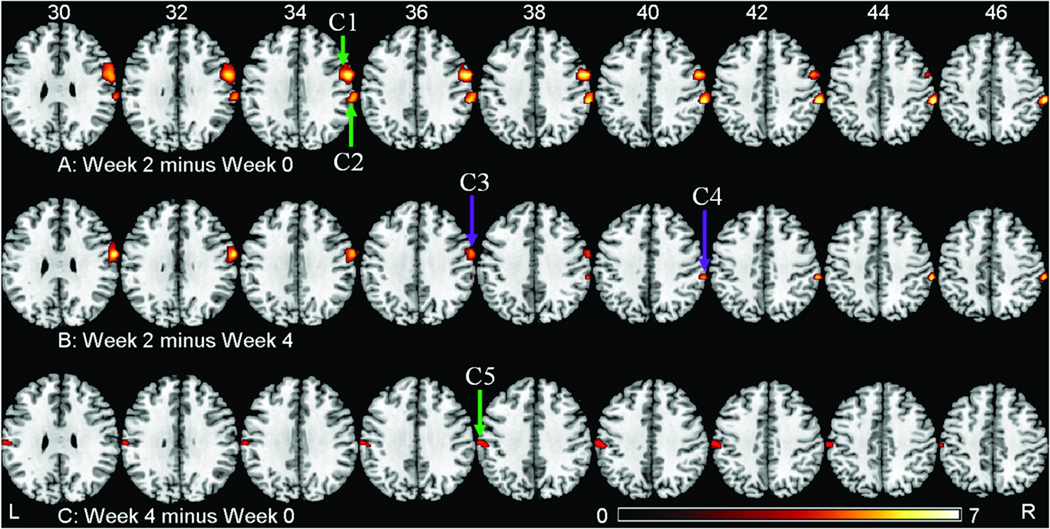
Figure 2.
Significant clusters (planned comparison among the test points) of resting state network of motor system found by the SPM second-level full-factorial analysis, based on the output (z maps) from ICA analysis. The significant clusters are overlaid in color on axial slices of an MNI template brain. The number above each slice indicates slice location (mm) of MNI z coordinate. Scale on color bar represents voxel t values. Left (L) side in the figure is left hemisphere of the brain, and right (R) side of figure is right hemisphere of brain. A: Week 2 minus Week 0 planned comparison. B: Week 2 minus Week 4 planned comparison. C: Week 4 minus Week 0 planned comparison. C1 to C5 denote Cluster 1 to Cluster 5.

