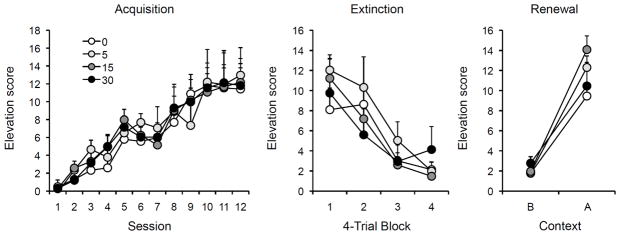
Figure 4.
Results of Experiment 3. Left: Mean elevation scores (plus or minus standard errors of the mean) during each 16-trial session of discriminated operant training (acquisition). Center: Mean responding (plus or minus standard errors) during successive 4-trial blocks of the single extinction session. Right: Mean elevation scores (plus or minus standard errors) during the 10-min test sessions in the extinction context (B) and the renewal context (A). Note the change in y-axis between panels. 0, 5, 15, and 30 = doses (in mg/kg) of DCS.

