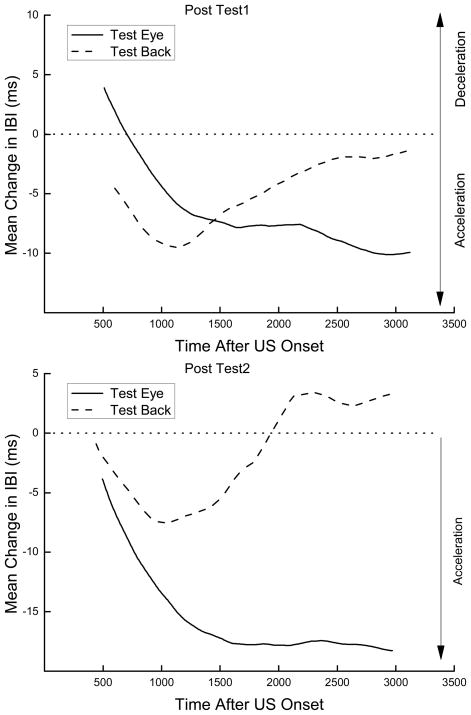
Figure 4.
Two panels show the averaged topography of changes in interbeat interval from baseline to a 2-mA electrical stimulus tested near the eye (Test Eye) or on the back (Test Back) during unconditioned stimulus testing over the first 20 trials for Post Test 1 (top panel) and Post Test 2 (bottom panel).

