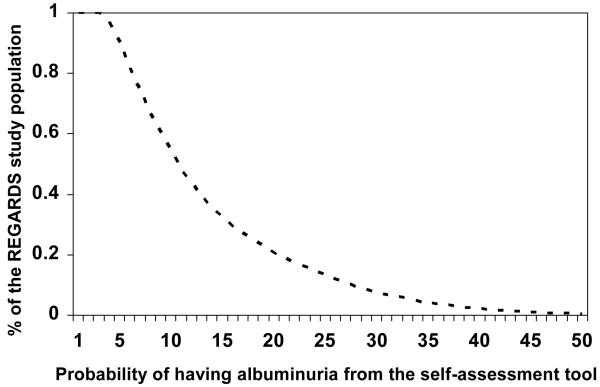
Figure 1.
Distribution of the REGARDS study population by probability of albuminuria on the self-assessment tool
The curve shows the % of the REGARDS study population with a probability of albuminuria higher than the value on the x-axis. For example, 54% of the REGARDS study population has a probability of albuminuria from the self-assessment tool ≥ 10%.

