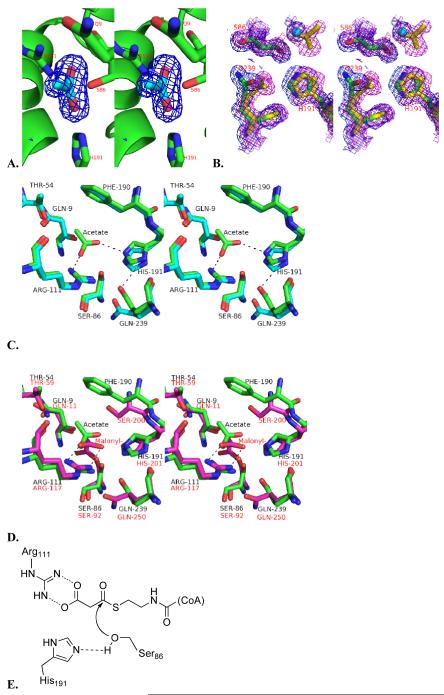
Figure 3.
A. Stereoview of an OMIT Fo – Fc electron-density map of the active site, contoured at 3 σ. The refined structure of the acetate, which was removed during the derivation of the omit map, is shown as cyan. B. Stereoview of the 2Fo – Fc electron-density map (contoured at 1 σ) of the active sites of both the free (blue) and acetate-bound DSZS AT (magenta). C. Stereoview of the aligned active sites of free (cyan) and acetate-bound DSZS AT (green). D. Active site alignment of the acetate-bound DSZS AT (green, black residue labels) and malonyl-AT from E. coli (2G2Z, [11], magenta, red residue labels). Note that the imidazole side-chain of DSZS AT His191 is rotated relative to the corresponding His201 of the S. coelicolor MAT. Accordingly, Gln239 of DSZS AT can interact with Nδ of His191, whereas the corresponding Gln250 of the MAT lacks this interaction and is oriented differently. Hydrogen bonding is represented by dotted lines. E. Proposed reaction mechanism for DSZS AT.

