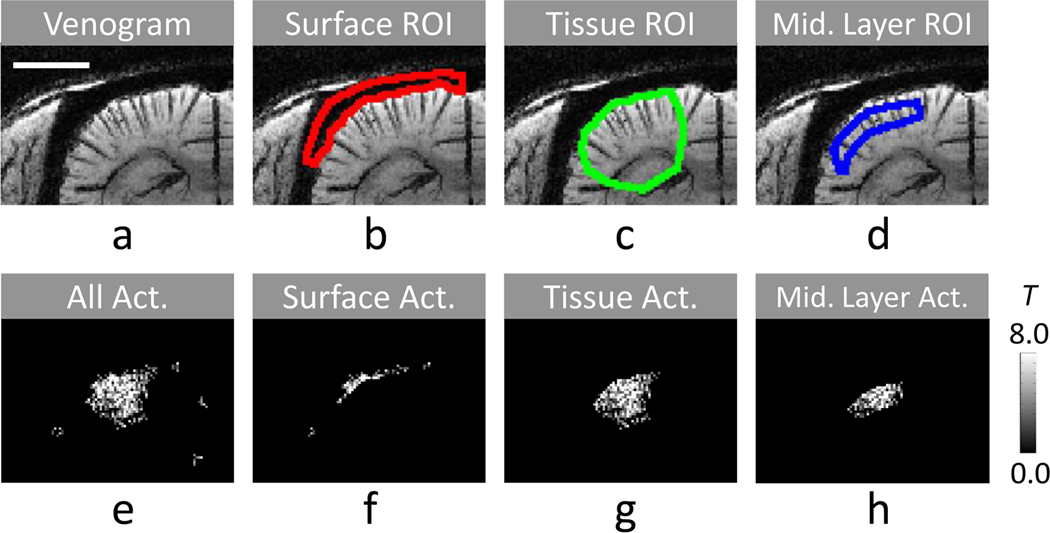
FIG. 2. Selection of ROIs and classification of functional activation pixels.
The cortical surface ROI (b), the tissue ROI (c), and the middle cortical ROI (d) were chosen based on venogram with minimum-intensity projection (a). Activation pixels were classified as cortical surface activation pixels (f), tissue activation pixels (g), and middle cortical ROI (h) from all activation pixels after cluster threshold (e). The fMRI map (e–h) was acquired from one representative animal with bSSFP at TR of 20 ms and phase cycling angle of 180°. The distance scale bar in a represents 3 mm.

