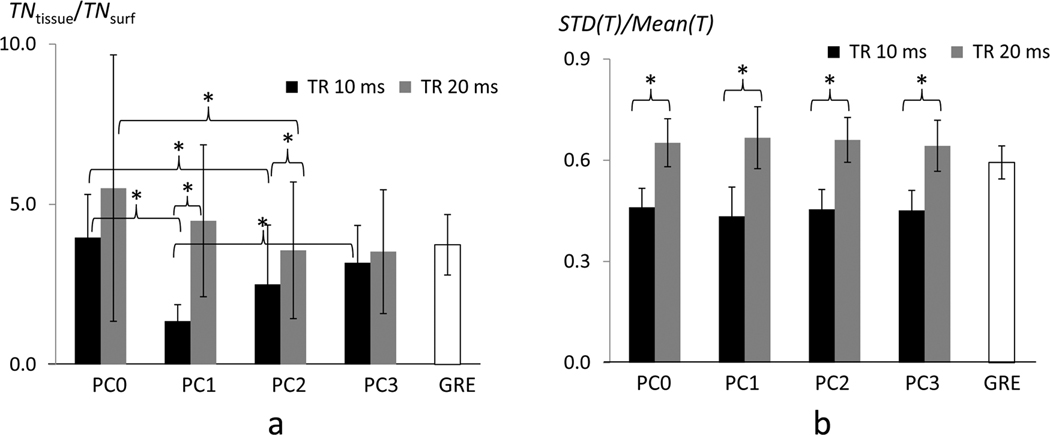
FIG. 6. Spatial specificity and homogeneity indices of four phase cycled bSSFP fMRI maps.
(a) Spatial specificity index determined as ratio of total fMRI sensitivities between tissue regions (Tissue) and cortical surface regions (Surf.) (TNtissue/TNsurf). (b) Homogeneity index determined as standard deviations divided by mean T values within the middle cortical ROI. The data are displayed for bSSFP fMRI maps with phase cycling (PC) angles of 0° (PC0), 90° (PC0), 180° (PC2), and 270° (PC3) and with TR = 10 ms and 20 ms, in comparison with GRE fMRI map. ‘*’ represents statistically significant difference (p < 0.05).

