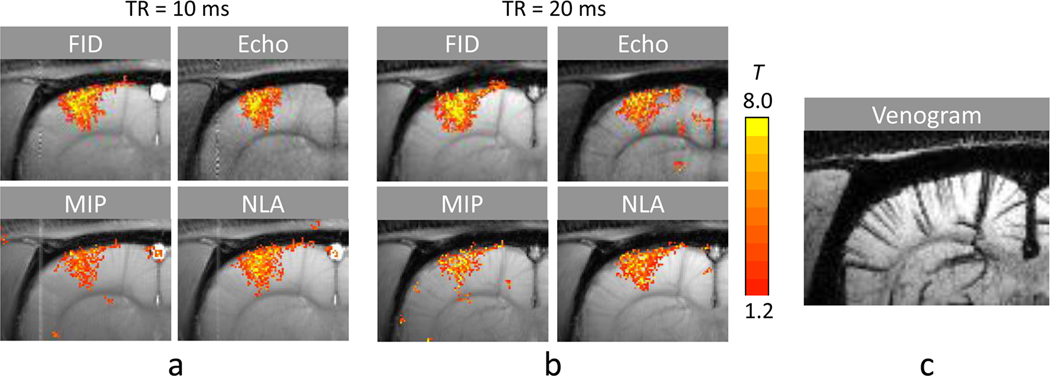
FIG. 7.
Functional MRI maps of FID, main echo, maximum intensity projection (MIP), nonlinear averaging (NLA) signals extracted from the multiple phase cycled bSSFP fMRI datasets. The data were acquired with TE/TR = 5/10 ms (a) and 10/20 ms (b) from an animal different from those shown in Figs. 2 and 4–5. The FID and main echo components were extracted with Fourier analysis from bSSFP fMRI datasets acquired with phase cycling angles of 0°, 90°, 180°, and 270°. (c) BOLD venogram with minimum-intensity projection applied over the slab corresponding to the position of the fMRI maps for reference to fMRI maps shown in a and b.

