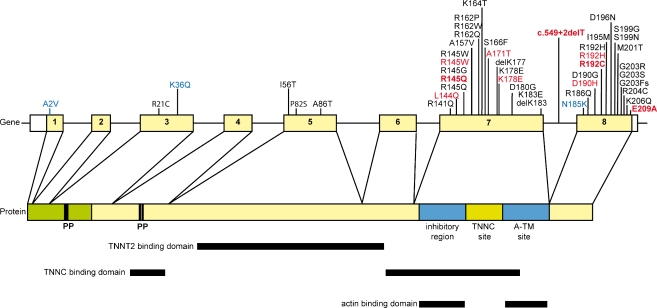
Fig. 1.
Schematic representation of the TNNI3 gene, the corresponding protein structure and the sites of interaction with sarcomeric contractile proteins. Mutations identified in this study and majority known from literature are indicated. Mutations identified in RCM patients are indicated in red, mutations identified in HCM patients are indicated in black and mutations identified in DCM patients are indicated in blue. The (novel) RCM mutations found in this study are indicated in bold red. Boxes indicate exons, thin lines indicate introns and thick lines indicate interacting domains. Phosphorylation sites are indicated by PP

