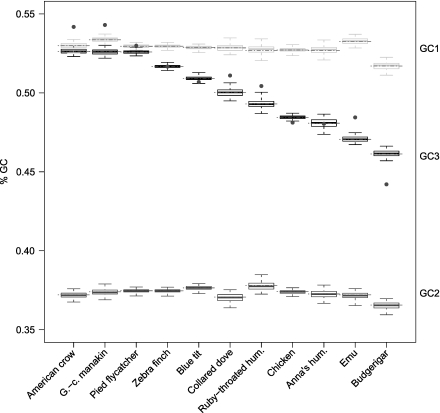
FIG. 1.
GC content at the 1st, 2nd, and 3rd codon position (GC1, GC2, and GC3) in light-gray, dark-gray, and black boxes, respectively. Dashed red lines show the observed value (number of Gs + Cs divided by the sequence length). Boxes give the quartiles of the distribution of the GC content obtained by bootstrapping of the original matrix (100 times); whiskers extend to the most extreme values obtained by bootstrapping. Grey dots are values corrected for missing data (see text).

