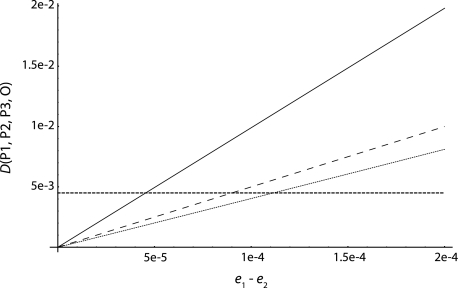
FIG. 5.
D(P1, P2, P3, O) as a function of the sequencing error difference e1 − e2. The dotted curve assumes that the probability to have an error in two populations is equal to the product of sequencing errors in the two populations (eij = ei × ej). The dashed curve corresponds to eij = min(ei, ej)/10, and the solid line assumes eij = min(ei, ej). The horizontal dashed line corresponds to twice the standard error of D, assuming that sites are independent.

